
Discover how a Canadian family achieved 239% returns using strategic...
Read MoreIs a Christmas Rally Coming? 2025 Market Signals Revealed
As December gets underway, this session will delve into a universally anticipated market topic: whether we will see the traditional “Christmas Rally” this year.
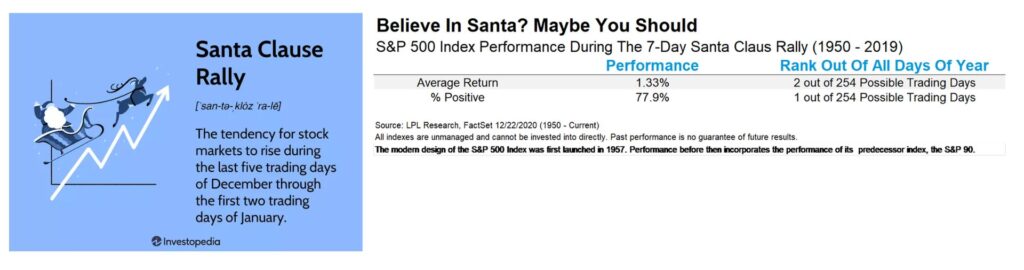
Defining the Christmas Rally and its Historical Roots
According to financial market custom and historical precedent, the Christmas Rally typically refers to a widespread rise in stock prices that occurs between the final trading week of December and the first two trading days of the following January. This term dates back to 1972 and has since become a key indicator used by investors to assess year-end market performance.
Core Drivers of the Christmas Rally
The emergence of the “Christmas Rally” is not coincidental; its momentum is primarily driven by the following structural and cyclical factors:
- Optimism and Consumer Spending: The arrival of the holiday season typically boosts market optimism, driving increased consumer confidence and expenditure, which supports the performance of retail and service sector companies.
- Year-End Fund Allocation: The close of the year is a crucial period for institutional and individual investors to conduct asset reallocation. The distribution of employee year-end bonuses often sees a portion flow into investment channels, augmenting market liquidity.
- Tax Optimization and Balancing: Many institutions and high-net-worth individuals execute specific portfolio adjustments and capital allocation strategies toward the year-end for tax-planning purposes, thereby impacting short-term market dynamics.
Quantitative Analysis of Historical Data
Based on historical statistics, the S&P 500 Index has recorded an upward trend during the Christmas Rally period in 77% of the years since 1945. This demonstrates a significantly high probability of market appreciation during this specific cycle.
Furthermore, the Christmas Rally period typically lasts for seven trading days, commencing from the first trading day after Christmas and extending to the second trading day of the new year.
The average gain across these seven trading days, according to historical data, amounts to 1.33%.
- Comparative Analysis: Since its inception in 1957, the S&P 500 Index has posted an average annual total return of approximately 11.7%.
- Return Contribution: This means the 1.33% gain realized over the short span of the Christmas Rally’s seven days has historically contributed over 10% of the index’s total annual average return.
Therefore, this seemingly modest 1.33% gain is highly significant in terms of time efficiency.
Given this historical pattern and the substantial potential returns, it is essential to examine whether a market rally is likely to emerge this Christmas season.
Our seminar discussion will be structured around these three core components:
- Reviewing the characteristics and patterns of historical Christmas Rallies.
- Analyzing the market conditions and probability of a Christmas Rally in the current year (2025).
- Proposing strategic advice for investors seeking to capitalize on opportunities in the current market environment.
Quantifying the Christmas Rally in Historical Data
We begin by examining the historical frequency of the Christmas Rally using quantitative data.
Based on a statistical analysis by the AiF Research Institute concerning the performance of the Dow Jones Industrial Average (DJI) over the past 50 years (from 1975 to 2024) during the Christmas period:
- Across these five decades, the DJI recorded gains during the Christmas period in a total of 35 years (marked in blue).
- Declines occurred in 15 years (marked in red).
This data reveals that the market appreciated during the Christmas period in 70% of the past 50 years. This confirms that the Christmas Rally exhibits a high frequency of occurrence from a long-term statistical standpoint.
Detailed Analysis of the Last Decade (2015-2024)
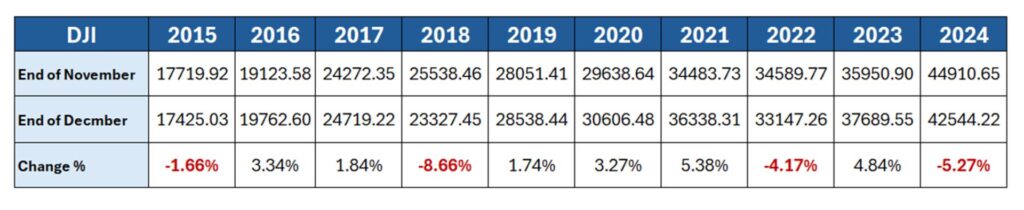
Narrowing the timeframe to the most recent decade (2015 to 2024), we conducted a more granular examination of the Dow Jones Industrial Average’s monthly gains and losses in December:
-
Out of these ten years, the DJI posted gains in December during 6 years.
-
Declines occurred in 4 years.
This implies that, over the past decade, the probability of the Dow rising in December stands at 60%.
The Significant Impact of Monthly Gains
While the monthly gain and loss figures on the chart may appear modest—for instance, the highest monthly gain recorded was 5.38% in 2021, and the largest decline was -8.66% in 2018—investors must grasp the true significance of these monthly movements:
-
Rarity of High Monthly Returns: If a 5.38% gain were realized every month, the annualized return would significantly exceed 60%.
-
Comparison to Annual Average Return: Considering the Dow Jones Industrial Average’s long-term average annual gain is approximately 11%, a single month like December 2021 contributing over 5% of the return is considered a massive gain, placing it squarely within the definition of a strong Christmas Rally.
The Pivotal Impact of December on Full-Year Returns: The 2018 Example
The market performance in December is absolutely crucial in determining the final full-year return. We can examine the year 2018 as a compelling example:
-
2018 Full-Year Trend: From January through the end of November 2018, the Dow Jones Index was largely in a consolidation (or sideways) trend, with the year-to-date change being near zero.
-
The Decisive December Decline: However, the Dow recorded a substantial drop of $-8.66\%$ in December. This single-month rout ultimately caused the Dow Jones Index to finish 2018 with an overall annual loss of $-5.63\%$.
These figures clearly demonstrate that the market’s behaviour in December—particularly whether a Christmas Rally materializes—is a critical factor influencing annual investment returns.
In the following section, we will conduct a detailed analysis of the December trend for each year over the last decade.
Historical Christmas Rallies: Year-by-Year Review (2015-2024)

2015: The Impact of the First Rate Hike
| December Change | Trend Characteristics |
| -1.66% | Consolidated during the first half of the month, followed by a slight late-month uptick before a rapid decline. |
Market Context and Drivers:
-
Heightened Financial Regulation: Drawing lessons from the 2008 subprime mortgage crisis, the Obama administration fully implemented the Volcker Rule in the second half of 2015, aimed at strengthening financial oversight.
-
The First Rate Hike Shock: Federal Reserve Chair Janet Yellen announced an interest rate increase—the first hike in nearly a decade, since 2006. This action officially signaled the end of years of quantitative easing (QE).
-
Market Interpretation: The dual certainty of increased financial regulation and the commencement of the tightening cycle created a massive shockwave across the market. This pressure ultimately led the index to decline after an initial period of hesitation, reaffirming the market’s high sensitivity to definitive policy signals.
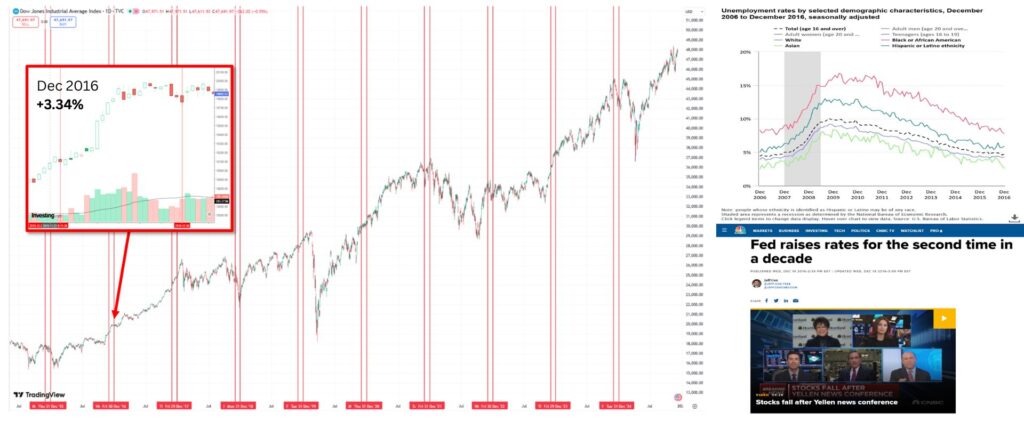
2016: Economic Recovery and the Arrival of the “Stock President”
| December Change | Trend Characteristics |
| +3.34% | A strong month, opening high and continuing upward. It charged aggressively through the start of the month, saw minor consolidation mid-month, and showed no meaningful pullback towards the close. |
Market Context and Drivers:
-
Full Economic Recovery: The U.S. economy completely emerged from the shadow of the 2008 financial crisis, marked by a full-scale recovery in the job market.
-
Stellar Employment Data: The year-end unemployment rate fell back to its 2007 low, indicating that the employment rate had climbed to historical highs. This improvement in job prospects directly boosted consumer income and spending, stimulating overall economic growth.
-
Explosive Consumer Confidence: The Consumer Confidence Index reached its highest level in 12 years (since 2004).
-
Trump’s Election: Donald Trump was elected President for the first time at the end of 2016. The market widely viewed the inauguration of the “businessman president” (informally dubbed the “Stock President”) as a major shot in the arm for the stock market, injecting positive policy expectations.
Although the Federal Reserve anticipated raising rates due to an overheating economy, the robust economic fundamentals and positive political outlook successfully offset these rate hike concerns, resulting in a 3.34% gain for the month.
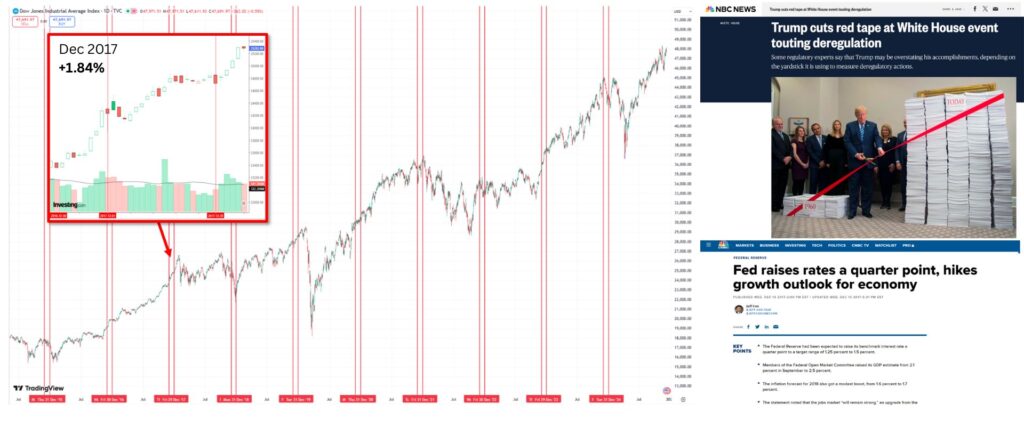
2017: Boosted by Tax Reform and Financial Deregulation
| December Change | Trend Characteristics |
| +1.84% | Steady gains throughout the month, with continuous upward movement. |
Market Context and Drivers:
-
Favourable Policy Environment: Following his inauguration, President Trump quickly initiated financial deregulation (attempting to dismantle the Volcker Rule) and vigorously pursued the Tax Cuts and Jobs Act.
-
Rate Hikes Amidst Economic Overheating: The economic momentum was robust at the time, prompting the Federal Reserve to continue raising rates to counter an overheating economy.
-
Market Desensitization to Hikes: The strong economic foundation meant the market was not deterred by the rate hikes; the increases failed to halt the month’s appreciation. Amid the positive policy landscape, the market maintained its upward trajectory.
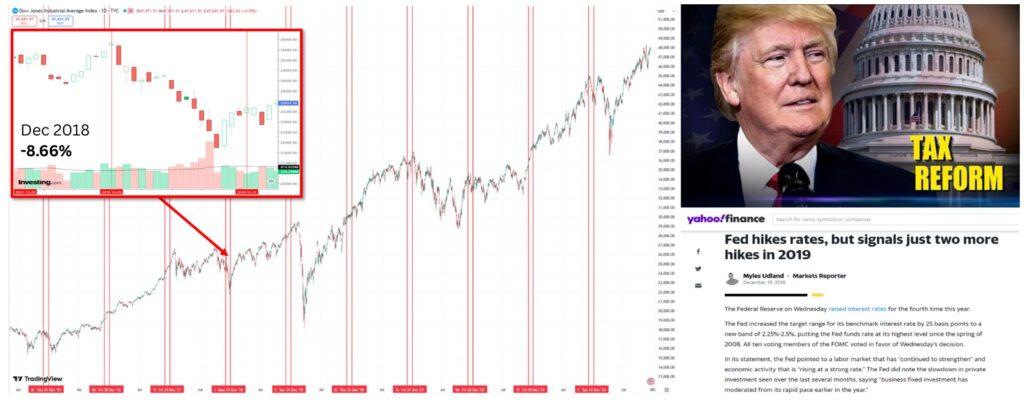
2018: The “Double Whammy” of Trade War and Rate Hikes
| December Change | Trend Characteristics |
| -8.66% | A significant decline starting early in the month, lacking rebound momentum, and trending downward continuously. |
Market Context and Drivers:
-
Trade War Eruption: The U.S.-China trade war began in March 2018. The trade conflict introduced massive uncertainty (risk) into the market, prompting investors to exit and adopt a wait-and-see approach.
-
Positive News Nullified: Despite the positive tailwinds from tax reform throughout the year, the gains were entirely offset by the panic and unpredictability stemming from the trade dispute.
-
Sustained Fed Hikes: With the market already engulfed by uncertainty, the Federal Reserve continued its rate hikes. The combination of economic ambiguity and short-term hawkish news led to a sudden crash in December.
-
Impact on Annual Performance: Before the December plunge, the Dow was actually up through the end of November (approximately +3%). However, the $-8.66\%$ drop in December directly resulted in the 2018 full-year return being negative ($-5.63\%$). This highlights the decisive influence of December’s performance on the entire year’s results.
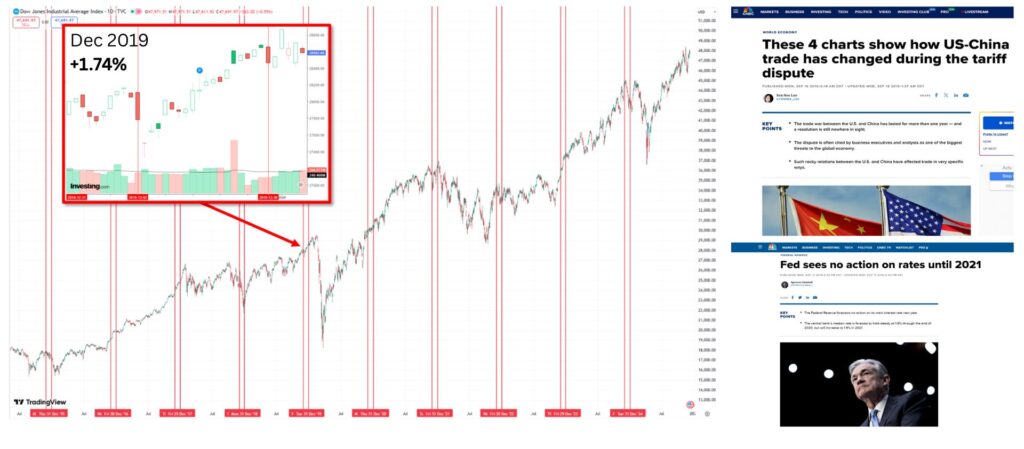
2019: Climbing the Wall of Worry and Record-Low Unemployment
| December Change | Trend Characteristics |
| +1.74% | Opened lower early in the month, then quickly stabilized and trended upward persistently, resulting in a solid gain. |
Market Context and Drivers:
-
Diminished Trade War Impact: The trade conflict had persisted for nearly two years (from early 2018 to the end of 2019). Investors began to realize that despite the heightened rhetoric, the market had not collapsed; instead, it remained resilient. This phenomenon is famously known in investing as “climbing the wall of worry.”
-
Record-Low Unemployment: The U.S. unemployment rate dropped to $3.5\%$, marking the lowest point in 50 years. This factual data demonstrated that the foundational U.S. economy had not been damaged by the trade war.
-
The Fed Pauses Hikes: The Federal Reserve announced in December 2019 that it would pause interest rate hikes until 2021, providing a significant boost to the market.
These three major positive factors calmed market sentiment and propelled a solid month of appreciation.
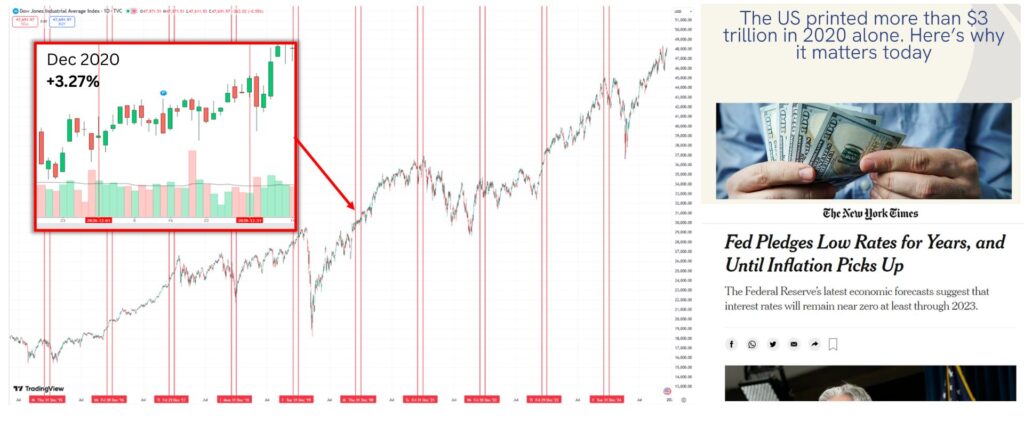
2020: The “Money Bull Market” Driven by Liquidity Flood
| December Change | Trend Characteristics |
| +3.27% | Minor consolidation early in the month, followed by a sudden, aggressive surge toward the end of the month. |
Market Context and Drivers:
-
COVID-19 Outbreak: The pandemic caused a global economic standstill, with cities locked down worldwide and non-essential business activities halted. Logic suggested this should lead to a recession and a market crash.
-
Government Intervention via Money Printing: Governments globally, especially the Federal Reserve, deployed extreme counter-measures: massive Quantitative Easing (money printing) and sustained interest rate cuts, attempting to offset the impact of the economic shutdown with liquidity.
-
The “Money Bull Market”: Despite the paralyzed economy, the U.S. stock market hit all-time highs within just a few months. This bull market, essentially engineered by government liquidity, resulted in exceptionally high returns for financial investors that year.
-
Low-Rate Expectations: The Federal Reserve committed to maintaining a near-zero interest rate policy until after 2023, providing the market with the expectation of low funding costs for the long term.
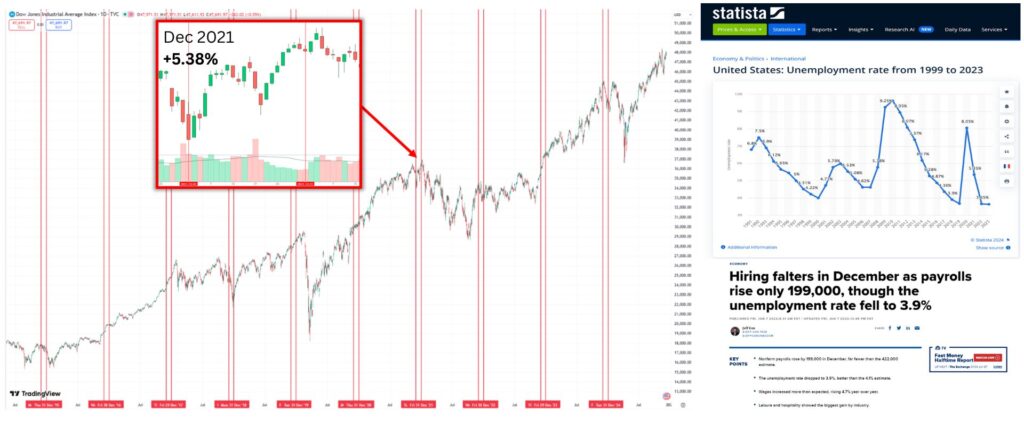
2021: Robust Economic Recovery Post-Pandemic
| December Change | Trend Characteristics |
| +5.38% | The largest December gain of the past decade. Characterized by fierce early momentum, a brief mid-month pullback, and then a sustained rally to the close. |
Market Context and Drivers:
-
Return to Normalcy: The impact of the pandemic gradually subsided, and public life and work began to resume normal patterns. The stock market, acting as a leading economic indicator, reacted preemptively.
-
Unemployment Back to Pre-Pandemic Levels: The unemployment rate, which had soared to $14.7\%$ early in the pandemic, had fallen to $7\%$ by the end of 2020. By December 2021, the rate had swiftly dropped to $3.9\%$, essentially recovering to pre-pandemic levels.
-
Confidence Boost: The rapid decline in unemployment coupled with steady economic recovery provided a powerful “all-clear signal” to the market. This strong economic fundamental spurred the largest Christmas Rally of the past ten years.
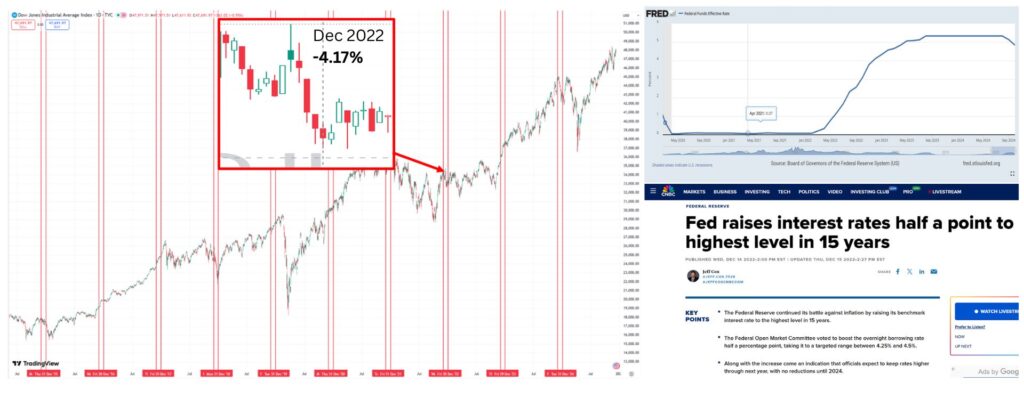
2022: The Backlash of Aggressive Fed Rate Hikes
| December Change | Trend Characteristics |
| -4.17% | The second-largest December decline of the past decade. Selling pressure began early in the month, with weak rebound attempts and an ultimately irreversible downward trend. |
Market Context and Drivers:
-
Uncontrolled Inflation: The massive liquidity injections from prior years led to soaring inflation.
-
Aggressive Tightening Cycle: To curb the runaway inflation, the Federal Reserve initiated an aggressive and rapid interest rate hiking cycle starting in March 2022.
-
Severe Market Reaction: The continuous, substantial rate increases severely impacted market valuations. The market had already been trending downward for the first nine months of 2022, and the December decline further compounded the losses, resulting in a significant negative full-year return.
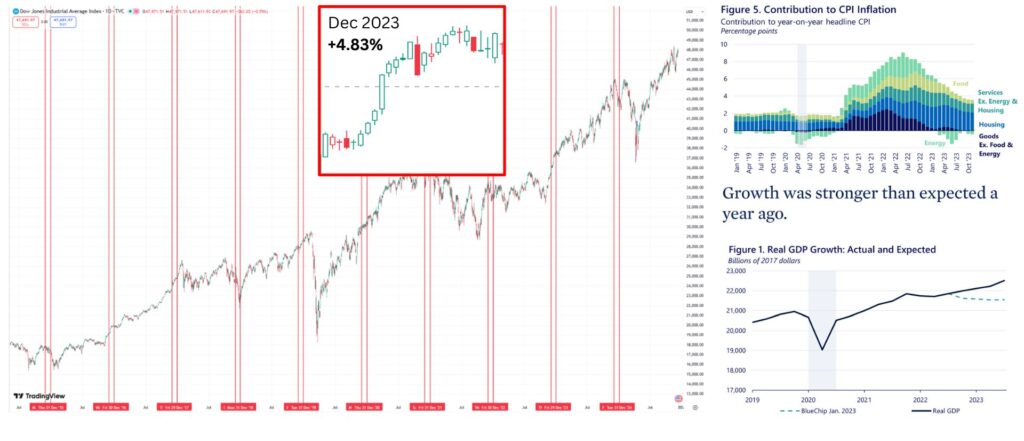
2023: Inflation Brought Under Control
| December Change | Trend Characteristics |
| +4.83% | A sustained, swift, and strong rally, marking a very impressive upward trend. |
Market Context and Drivers:
-
Significant Inflation Decline: The impact of sustained rate hikes became apparent, as inflation was effectively brought under control. It dropped from a peak of around 8% in 2022 to approximately 4.1%, nearly cut in half.
-
Easing Overheating Concerns: The decline in inflation signaled that the risk of an overly heated economy was being managed effectively.
-
Boosted Market Confidence: The mitigation of macro risks lifted market confidence, which triggered the emergence of a robust Christmas Rally.
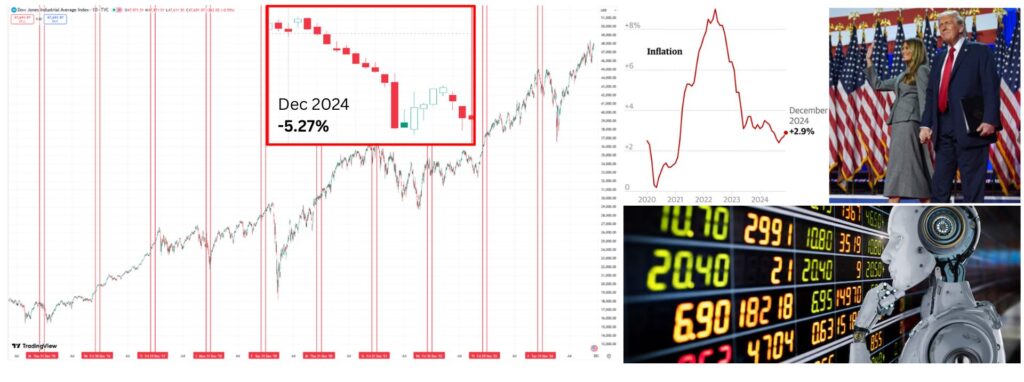
2024: Policy Uncertainty and Profit-Taking
| December Change | Trend Characteristics |
| -5.27% | The poorest December performance of this cycle. The decline was sustained throughout the month. |
Market Context and Drivers:
-
Strong Full-Year Foundation: Despite the December decline, the market was up approximately 13% for the full year, driven by the AI craze and positive sentiment surrounding the U.S. General Election.
-
The unemployment rate remained at historical lows, maintaining solid consumer spending.
-
The market was optimistic about the prospect of an economic “soft landing.”
-
GDP sustained positive growth, providing a stable foundation for corporate earnings.
-
-
Policy Uncertainty: Although inflation was controlled and approached the 2% target, and the Federal Reserve began a cycle of interest rate cuts, the sharp preceding rally led the market to price in concerns over policy uncertainty (such as new tariffs or shifts in supply chains) and profit-taking pressures.
-
Impact on Annual Performance: Despite the full-year gain of 13%, the annual return could have reached approximately 18% had it not been for the $-5.27\%$ drop in December. This once again underscores the profound impact December’s performance has on the final yearly return.
2025 Market Outlook and Investment Strategy Summary
Core Drivers Behind the Robust 2025 US Stock Market Rally
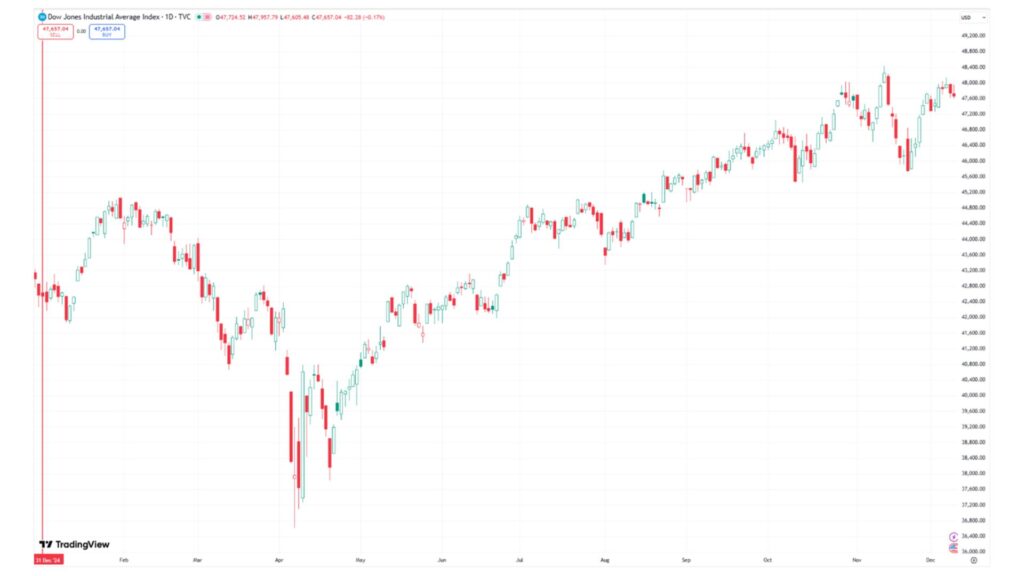
Following our review of historical Christmas Rally patterns, we now analyze the current market environment to assess the trend for 2025. To date, the Dow Jones Industrial Average (DJI) has repeatedly hit all-time highs and recorded a respectable 12% gain. The sustained ascent of the US market in 2025 is primarily fueled by three core dynamics:
A. Solid Corporate Earnings and Enduring Economic Resilience
The U.S. economy has successfully achieved a “soft landing” after navigating the high-inflation cycle. Earlier market concerns that high interest rates might trigger a recession have largely subsided. With the economy maintaining growth, corporate earnings continue to surpass expectations. Crucially, the 2025 rally is characterized by “inclusiveness”:
-
Traditional sectors (such as Financials and Industrials) are also demonstrating exceptional strength, providing a very solid foundation for the Dow.
B. Deepening Application of the Artificial Intelligence (AI) Boom
Artificial Intelligence has become a powerful structural force. We defined 2024 as the year for AI infrastructure build-out, while 2025 is proving to be the year of AI application depth. Investor focus is shifting from foundational hardware (chips, servers) to how AI can be leveraged to boost efficiency and generate new revenue streams across traditional industries. This technological iteration and commercial deployment continue to bring a valuation premium to the entire US stock market.
C. Balanced Policy Expectations and Hedging
The 2025 US market surge is the result of a strong combination of robust earnings fundamentals and the disruptive AI technological trend. This dominant trend has effectively hedged against complex macroeconomic policy shifts and political uncertainties.
Our Investment Thesis on the “Christmas Rally”
Based on the analysis above, we return to the most frequently asked question: Will we see a Christmas Rally this year?
Ai Financial’s core thesis is clear: We do not attempt to forecast the occurrence of this year’s Christmas Rally.
Long-Term Trend Outweighs Short-Term Volatility
-
Fact-Based Approach: We insist on a fact-based approach. The market has already delivered a substantial 12% gain this year. Whether we see a short-term pullback or a one-week rally, the overall upward trajectory for 2025 remains unchanged.
-
The Non-Issue: The key question is not “Will there be a Christmas Rally this year,” but rather whether the overall upward trend has delivered on our investment returns.
The Certainty of the Bull Market
-
Historical Performance: Reviewing history, despite only 6 Christmas Rallies versus 4 years of decline in the past decade, the Dow Jones Industrial Average delivered a cumulative return exceeding 2.39 times over the ten-year period.
-
Fundamental Drivers: This clearly illustrates that the certainty of the bull market is rooted in the continuous accumulation of societal wealth and sustained economic expansion.
Investment Strategy Summary: Follow the Trend
Our investment strategy is straightforward: Do not waste energy focusing on whether a fleeting Christmas Rally appears; instead, align your strategy with the prevailing uptrend and embrace the bull market.
Only by adhering to the broad bull market trend—driven by economic growth and corporate profitability—can we achieve sustainable returns in the financial investment landscape.

Investment Strategy: Align with the Bull Trend and Professional Asset Allocation
Risk Perception: Failure to Invest Means Devaluation of Wealth
We maintain an optimistic outlook for the market next year. As we head into December, defining our investment strategy is crucial. While inflation has been brought under control in recent years, a return to the historical average of $2\%$ is largely off the table. As former Federal Reserve officials have noted, inflation has evolved into a structural, long-term challenge, with future expectations suggesting it will remain at $3\%$ or a higher level.
-
Not Investing Means Being Impoverished: This signifies that any growth in personal wealth that lags behind the inflation rate will result in a continuous decline in real purchasing power. Therefore, investing is no longer an option, but a necessary measure to combat persistent long-term inflation.
Beware of Risk: The Principles of Professional Investing
In their pursuit of wealth growth, investors must be wary of the risks associated with the “get-rich-quick” mentality, which often creates a breeding ground for fraud. Genuine investing requires adherence to professional principles:
-
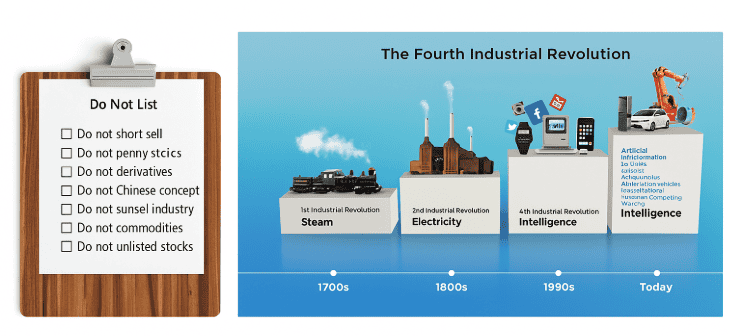
Professional Management: Investment must be managed by professional, financially regulated institutions, such as us at Ai Financial. These firms possess mature investment systems and principles (e.g., our adherence to the “Eight No-Go Principles”) to ensure the safety of client capital and its allocation into valuable enterprises and industries.
-
Trend Identification: With the explosive growth of the Fourth Industrial Revolution centered on Artificial Intelligence (AI), wealth is transferring and growing at an accelerating pace. We must direct capital toward the right sectors to capture genuine wealth creation.
The Gold Standard of Investing: Shun Speculation, Choose Diversified Allocation
We strongly advise investors against purchasing individual stocks.
-
Individual Stock Risk: Buying single stocks is essentially engaging in probabilistic speculation. While speculation might yield short-term profits, it ultimately leads to losses over the long run.
-
The Correct Investment Path: The true gold standard of investing is the purchase of publicly offered Segregated Funds.
Advantages of Segregated Funds:
-
Diversification and Risk Mitigation: Segregated Funds buy a basket of stocks rather than a single company. This achieves a risk hedge, embodying the “if one star doesn’t shine, another will” approach, and helps investors disperse risk (“don’t put all your eggs in one basket”).
-
Capture Market Profits: Diversification both minimizes the risk associated with a single stock and allows the investor to fully capture the profits from the overall market rally.
Seizing the Bull Market: The Leverage of Investment Loans
A critical investment tool is utilizing an Investment Loan to purchase Segregated Funds.
-
Investment Loan Principle: An investment loan is equivalent to “borrowing a hen to lay eggs”—the investor borrows funds for investment, and the ultimate returns (the eggs laid) belong entirely to the investor.
-
Leveraging Financial Tools: This function of using an investment loan to purchase Segregated Funds is typically only available through financial products offered in exclusive partnership with professional institutions (like the banks we collaborate with). Investors should fully utilize such financial tools to leverage this opportunity and capture the growth of the massive bull market that is currently unfolding.
Q&A Summary: Market Hot Topics and Investment Strategy
| Question | Answer |
| Q1: How will the Bank of Japan’s rate hike impact global markets and investment opportunities? | Japan’s rate hike is an extremely unusual and positive signal. After its “lost three decades,” Japan maintained near-zero or negative rates to stimulate the economy, indicating poor economic health. The current hike signals that: 1. Economy is Recovering: The hike is typical of an overheating economy, showing Japan is genuinely recovering and getting back on track. 2. Survival of the Fittest: By raising borrowing costs, the hike weeds out weaker businesses, ensuring only high-quality companies remain—a process of natural selection. Therefore, the hike is a major, long-term positive. While our investment focus has been primarily on the US market, we now see vast opportunities in a recovering Japanese economy, evidenced by investment masters like Warren Buffett injecting capital there. We at Ai Financial are actively sourcing suitable Japanese funds, planning to allocate capital for clients to seize this massive upward channel. |
| Q2: Regarding the continuation of the “Christmas Rally,” is the market likely to keep rising into the New Year? | Based on market inertia, there is a possibility that the market will continue to appreciate into the New Year. However, our principle remains to never rely on short-term speculation. Market volatility is normal; our core focus is the total annual return on investment. Our portfolios have delivered a strong 12% return year-to-date, and we prioritize the stability of maintaining a positive return, regardless of short-term fluctuations. |
| Q3: What is the short-term impact of the Federal Reserve’s December rate cut on the US stock market? | A rate cut is a clear stimulus signal for the economy. From a short-term perspective, the cut provides a strong boost to the US stock market. For example, the market recently rallied over 1,200 points in two days, which is precisely the market’s positive reaction to the significant tailwind of a rate cut, distinctly stimulating short-term growth. |
| Q4: Why is the US stock market’s gain (DJI, Nasdaq) lower this year than last, yet you still call the performance excellent? | The ultimate measure of market health is whether it achieves an annual gain. The market is already up 12% this year, which is an excellent performance. We cannot demand that the market achieves last year’s exceptionally high levels (with an overall gain exceeding 20%) every year. A positive return of 12% is robust and satisfactory, indicating healthy market fundamentals. |
| Q5: Are the Canadian and US stock market trends similar? Why does your firm not invest in the Canadian market? | The trends are completely dissimilar. US Market: The US market rally is built on solid economic fundamentals, including robust employment and support from real, tangible enterprises; the degree of market “froth” or overvaluation is relatively low. Canadian Market: The appreciation in the Canadian stock market is currently decoupled from its actual economic state. Unemployment is hitting new highs, numerous small and medium-sized enterprises face closure, and the economic foundation is unstable. The rally in the Canadian market is a classic bubble phenomenon, lacking the support of the real economy. |
Subscribe
Connect with
Login
I allow to create an account
When you login first time using a Social Login button, we collect your account public profile information shared by Social Login provider, based on your privacy settings. We also get your email address to automatically create an account for you in our website. Once your account is created, you'll be logged-in to this account.
DisagreeAgree
Connect with
I allow to create an account
When you login first time using a Social Login button, we collect your account public profile information shared by Social Login provider, based on your privacy settings. We also get your email address to automatically create an account for you in our website. Once your account is created, you'll be logged-in to this account.
DisagreeAgree
0 Comments
Inline Feedbacks
View all comments
You may also interested in

Canadian Soldier Achieves 204% ROI with Investment Loan and Segregated Fund| AiF Clients
Zack, a Canadian soldier in his 40s, turned limited savings...
Read More
From $100K to $520K: How a Millennial Actuary Couple Achieved a 154% Leveraged Return| AiF Clients
Discover how a millennial actuary couple used investment loans and...
Read More
Can Non-Residents Invest in Segregated Funds in Canada?Hazel’s Journey with Ai Financial| AiF Clients
Hazel, a non-resident mother in Canada, invested CAD $200,000 across...
Read More
From Anxiety to Empowerment: How a Mom of 3 Gained $67K in 20 Months | AiF Clients
Zara, a working mom of three, turned $200K into $259K...
Read More